
The Problem
Every week, thousands of people in Toronto experience a mental health crisis that requires police intervention. These calls — known as Persons-in-Crisis (PIC) calls — are unpredictable, resource-intensive, and emotionally taxing on first responders. When demand spikes unexpectedly, crisis teams are stretched thin, response times suffer, and communities are left vulnerable.
The question we asked: Can we use data to predict when and where crisis demand will spike — so agencies can prepare in advance?
What We Set Out to Do
This project builds a predictive system that identifies which Toronto neighbourhoods are likely to experience a surge in crisis calls one week ahead of time. Think of it as a weather forecast — but for mental health crisis demand. If emergency services know which areas will need extra support, they can adjust staffing, deploy mobile crisis teams, and allocate resources before the pressure hits.
The Data Behind the Solution
We worked with two publicly available datasets:
- Over 344,000 police-attended crisis call records from the Toronto Police Service, spanning more than a decade (2014–2025).
- Census-based neighbourhood profiles from the City of Toronto, including population, income, employment, and demographic data across 140 Toronto neighbourhoods.
By combining these datasets, we built a comprehensive picture of crisis patterns across the city — not just when calls happen, but where and why.
Tools
- Python — end-to-end data pipeline (pandas, NumPy, scikit-learn, XGBoost)
- Jupyter Notebooks — exploratory data analysis and socio-economic dataset builder
- Power BI — interactive dashboard for visualizing crisis call trends and predictions
- Git / GitHub — version control and reproducible project structure
- Google Drive — project documentation, data storage, and team collaboration
- Canva — academic poster presentation of findings
What I Built
As part of a 4-person team, I was responsible for building the data engineering and preprocessing layer of the pipeline. Specifically:
Socioeconomic Data Integration Module — harmonized census data from three different years (2011, 2016, 2021), standardized inconsistent schema formats, aligned data at the neighbourhood-year level, and interpolated values across time to create a complete temporal dataset.
Feature Engineering Pipeline — designed and implemented over 20 predictive features including lagged variables, rolling statistics, and anomaly indicators, all constructed in a leakage-safe manner to capture temporal dependencies and seasonal patterns in crisis calls.
Walk-Forward Validation Framework — implemented walk-forward cross-validation with an embargo gap to prevent temporal leakage and ensure performance metrics reflect realistic deployment conditions.
Baseline Modeling Framework — developed a baseline benchmark to evaluate machine learning models against, ensuring the final model demonstrated meaningful improvement over simple heuristics.
Contributions to Power BI Dashboard — supported the development of an interactive dashboard for visualizing crisis call trends, surge predictions, and neighbourhood risk scores.
The full codebase is structured as a modular, production-style pipeline with reusable Python modules for preprocessing, feature engineering, modeling, and evaluation.
Key Outcomes and Business Value
Here’s what the results mean in plain terms:
- The system can identify high-risk neighbourhoods with 4x better accuracy than simply guessing based on historical averages. In practical terms, if a crisis response team has limited capacity and can only focus on the top 10% of at-risk areas, our model helps them target the right neighbourhoods.
- The model maintains consistent performance across seasons and years, meaning it’s reliable regardless of when it’s deployed — not just a system that works well during certain times.
- The predictions are explainable. The model doesn’t just say “this neighbourhood is high risk” — it can show which factors are driving that prediction. This transparency is essential when working with public sector agencies that need to justify resource decisions.
- The system focuses on neighbourhood-level demand, not individuals. This is an ethical design choice — it’s about helping agencies plan resources, not profiling or targeting specific people.
The project demonstrates a complete end-to-end analytics workflow — from raw public data to a deployed-ready predictive system, with documentation, dashboards, and reproducible code.
Why This Matters
This project showcases skills that directly translate to business analytics, operations, and decision-support roles:
- Turning messy, real-world data into actionable insights — exactly what companies need from data analysts.
- Building predictive systems that drive proactive decisions — the difference between reacting to problems and preventing them.
- Working with public sector data and ethical considerations — demonstrating judgment beyond just technical ability.
- Communicating findings to both technical and non-technical audiences — through dashboards, reports, and academic presentations.
If you’re a company looking for someone who can take a business problem, find the data, build a solution, and explain it clearly — this project is proof I can do that.
Screenshots / Dashboard Preview / Repo Link
GitHub Repository: https://github.com/CatherineCalantoc/crisis-early-warning
This repo contains the full project — code, documentation, model artifacts, and instructions to run the entire pipeline.
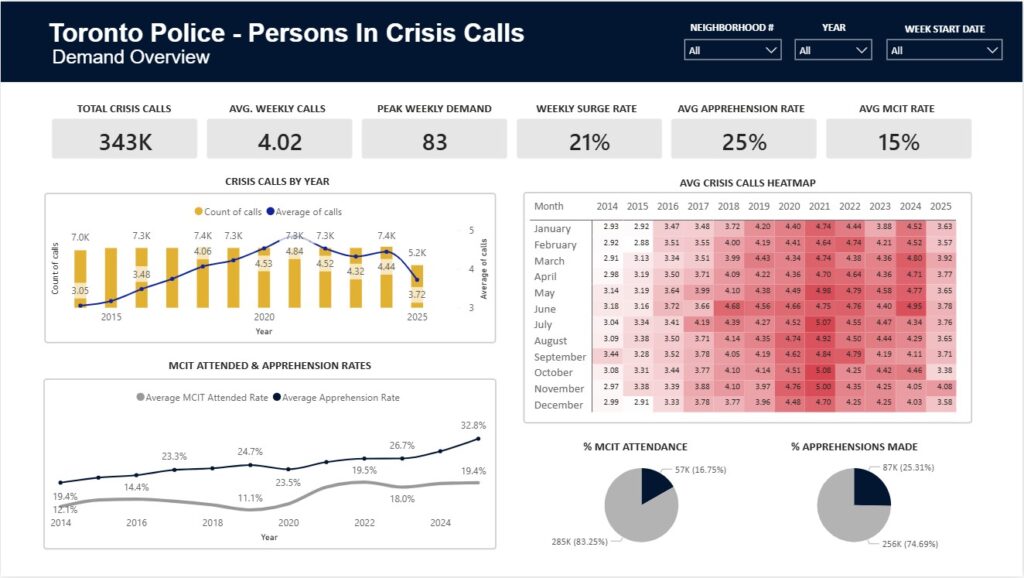
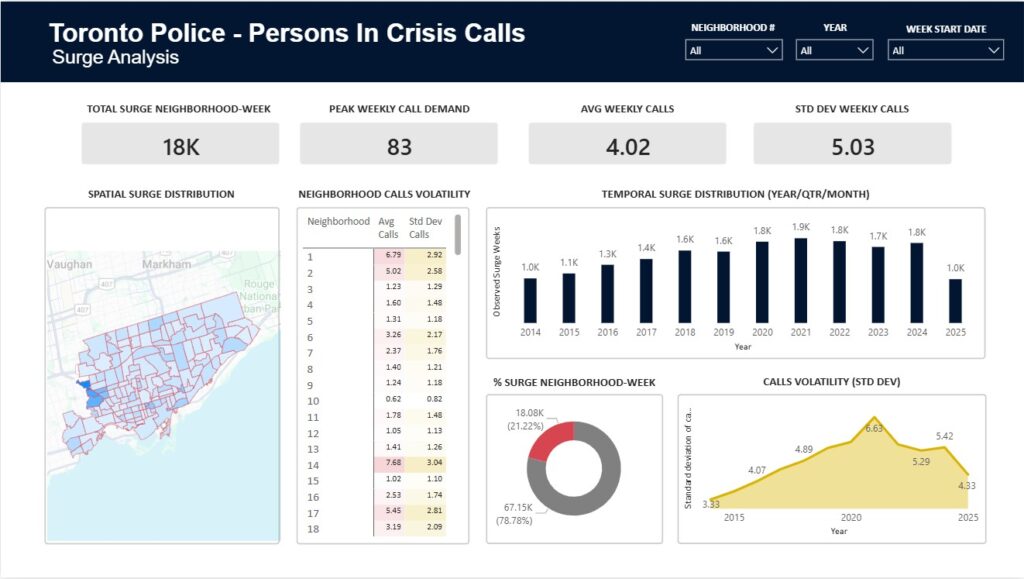
Power BI Dashboard: Interactive dashboard showing crisis call trends, neighbourhood risk scores, and predictive insights.
My Role and the Skills Demonstrated
Role: Data Engineering & Preprocessing Lead
I was responsible for building the data foundation of the entire project. Without clean, well-structured data, even the best models fail. My work ensured that every analysis and prediction in this project was built on reliable, reproducible data.
Skills Demonstrated:
- Data Engineering — Built a complete data pipeline from scratch, ingesting and transforming 344,000+ records from public data sources.
- Data Cleaning & Integration — Merged datasets with different formats, time periods, and geographic boundaries into a single, usable dataset.
- Feature Engineering — Created custom data points that capture real-world patterns, demonstrating deep understanding of the problem domain.
- Model Validation & Testing — Designed a testing framework that ensures predictions are reliable under real-world conditions.
- Python Programming — Wrote modular, reusable code that can be maintained and extended by others.
- Power BI Visualization — Translated complex predictions into interactive, stakeholder-friendly dashboards.
- Collaboration & Communication — Worked in a team of 4, contributed to academic writing, and presented findings through posters and reports.
- Version Control (Git/GitHub) — Maintained a clean, professional repository with documentation and reproducible scripts.
- Project Management — Coordinated data work across the team, aligned on methodology, and delivered a cohesive final output.
Team
This capstone was a collaborative effort by:
Lloyd Johnson V. Ballesteros, Catherine Calantoc, Dayanara T. Macalino and myself
Full Technical Details
For readers who want to dive deeper into the methodology, model architecture, and validation approach — the complete technical documentation is available in the GitHub repository linked above. The README includes detailed information on data sources, pipeline structure, performance metrics, and instructions to reproduce the results.
Tags
capstone project, data analytics portfolio, predictive analytics, crisis forecasting, Python, data engineering, Power BI, public sector analytics, mental health data, feature engineering, Toronto, data preprocessing, business intelligence, decision support, machine learning, data visualization, Git, GitHub