
The Problem
The CN Tower’s 360 Restaurant is a landmark destination for tourists and locals alike. With over 5,000 Google Reviews spanning nearly a decade, the restaurant has a wealth of customer feedback. But here’s the challenge: most reviews are positive, and the negative ones — the ones that matter most for improving service — are hard to spot in the noise.
For restaurant managers, this creates a blind spot. Without a clear way to identify patterns in dissatisfied customer feedback, service improvements become reactive rather than proactive. The question we asked: Can we build a system that automatically reads reviews, detects sentiment, and surfaces the insights that actually matter to the business?
What We Set Out to Do
This project builds a five-stage analytics pipeline that scrapes, cleans, analyzes, and visualizes Google Reviews for the CN Tower 360 Restaurant. The end result is a live, cloud-hosted dashboard that restaurant managers can use to:
- See overall sentiment trends at a glance
- Filter reviews by date, rating, and sentiment
- Get real-time predictions on new reviews
- Understand what drives customer satisfaction — and dissatisfaction
- Think of it as a command center for customer feedback.
The Data Behind the Solution
We worked with real Google Reviews data scraped directly from the CN Tower 360 Restaurant listing using Apify, a web scraping tool. The dataset includes:
- 5,161 real customer reviews collected over nearly 10 years (2016–2025)
- Star ratings (1–5 stars), review text, review dates, and reviewer information
- Sentiment labels (positive = 4–5 stars, negative = 1–3 stars)
The original dataset had a significant imbalance — most reviews were positive, making it difficult for machine learning models to accurately detect negative sentiment. Our pipeline addressed this through data balancing and augmentation techniques.
Tools Used
- Python — for data scraping, cleaning, sentiment analysis, and model training
- Jupyter Notebooks — for exploratory analysis and documenting each stage of the pipeline
- Apify — for scraping Google Reviews data at scale
- HuggingFace Transformers — for building sentiment prediction models (DistilBERT, TinyBERT, DeBERTa)
- Streamlit — for building and deploying the live interactive dashboard on the cloud
- Git / GitHub — for version control and collaborative development
- Power BI — for additional business dashboarding
What I Built
As part of a 3-person team, I took ownership of the data engineering, dashboard development, and cloud deployment layers. Here’s what that involved:
Data Scraping & Collection — Used Apify to scrape thousands of Google Reviews from the CN Tower 360 Restaurant listing, transforming unstructured web data into a clean, structured dataset ready for analysis.
Data Cleaning & Preprocessing — Led the initial data cleaning stage, validating data schemas, standardizing fields, and preparing the dataset for downstream analysis. This included handling missing values, normalizing text, and ensuring data quality across the entire pipeline.
Exploratory Data Analysis (EDA) — Built the initial EDA that helped the team understand the distribution of reviews, identify class imbalance issues, and frame the fairness problem that guided the rest of the project.
Streamlit Dashboard Development — Designed and built the architecture for the final live dashboard, including interactive filters, real-time sentiment prediction, and business metrics visualization. This is the piece that turns the entire pipeline into something usable by non-technical stakeholders.
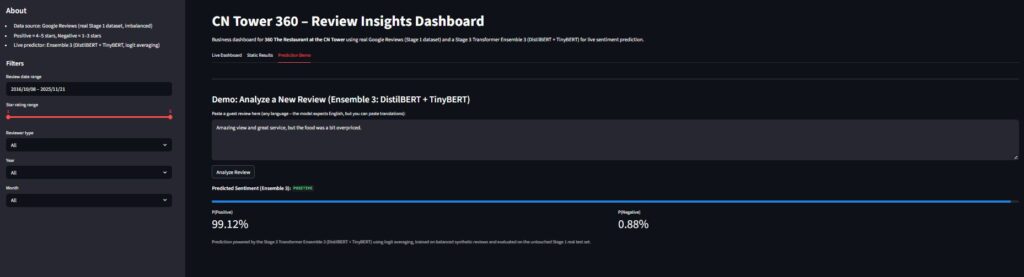
ML Model Integration — Integrated the team’s transformer ensemble model into the dashboard for real-time sentiment prediction, allowing users to input new review text and instantly get a sentiment classification.
Cloud Deployment — Deployed the complete dashboard to Streamlit Cloud, making it accessible from anywhere via a live URL. This demonstrates the ability to take a project from a local notebook to a production-ready, cloud-hosted application.
Documentation & Presentation — Contributed to the technical report and presentation, ensuring the team’s work was clearly communicated to both technical and non-technical audiences.
Key Outcomes and Business Value
Here’s what the results mean in plain terms:
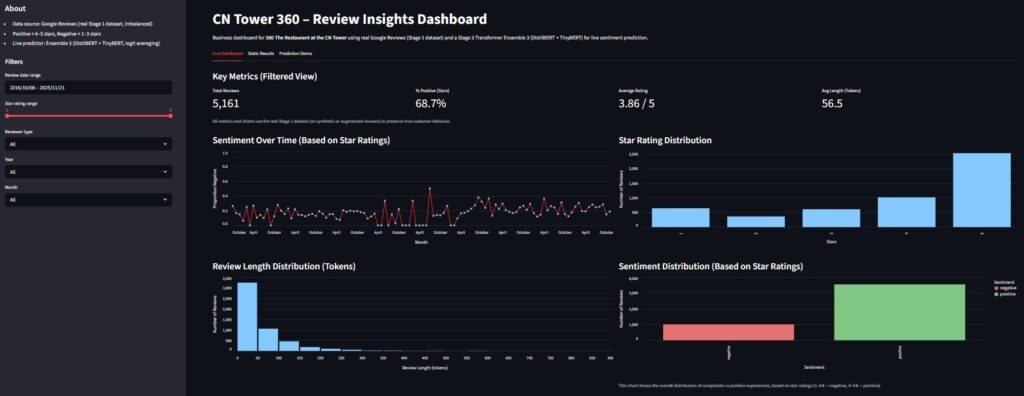
The dashboard provides instant visibility into customer sentiment. Managers can see at a glance that 68.7% of reviews are positive, with an average rating of 3.86 out of 5 stars — and track how these numbers change over time.
The system can automatically classify new reviews as positive or negative with high accuracy, using an ensemble of transformer models. This means managers don’t have to manually read every review to identify dissatisfied customers.
The pipeline scales to handle large volumes of data. By augmenting and balancing the dataset, we enabled the models to work reliably even with the natural imbalance in customer reviews (where positive reviews far outnumber negative ones).
The solution is cloud-deployed and accessible from anywhere. Unlike a local notebook or spreadsheet, the dashboard is a live, shareable tool that can be used by restaurant staff, managers, or stakeholders in real time.
The project demonstrates a complete end-to-end workflow — from scraping raw web data to deploying a cloud-hosted analytics application. This is the kind of full-cycle capability that companies look for in data analysts.
Why This Matters to Employers
This project showcases skills that directly translate to customer analytics, product feedback analysis, and business intelligence roles:
- Web scraping and data collection from real-world sources — a skill highly valued for competitive intelligence and market research.
- Natural language processing and sentiment analysis — directly applicable to customer feedback analysis, brand monitoring, and social media analytics.
- Building interactive dashboards for non-technical users — the ability to translate data into tools that stakeholders can actually use.
- Cloud deployment of data applications — demonstrating that you can take a project beyond the notebook and make it production-ready.
- Working with imbalanced, messy real-world data — exactly what you’ll encounter in business settings, not clean textbook examples.
If you’re a company looking for someone who can turn raw customer data into an actionable, cloud-hosted tool — this project is proof I can do that.
Screenshots / Dashboard Preview / Live Link
Live Streamlit Dashboard: https://sentiment-intelligence-dashboard-nkr2025.streamlit.app/
The dashboard includes three tabs:
Live Dashboard — Real-time metrics, filters, and sentiment trends
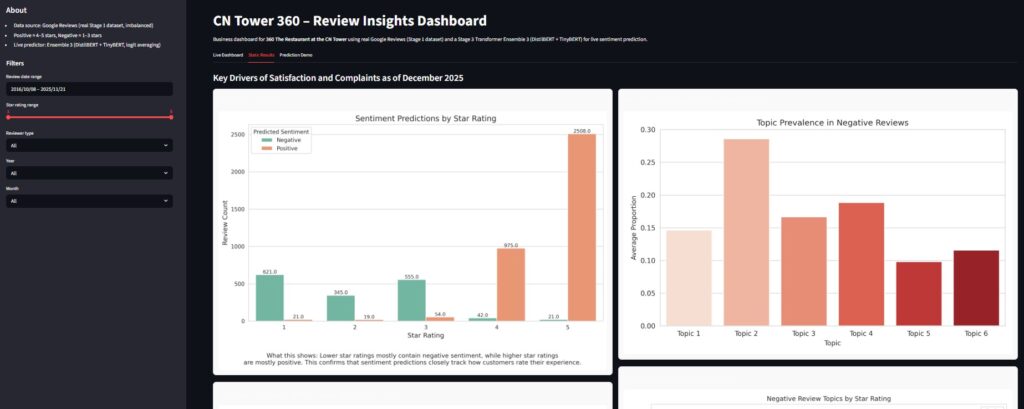
Static Results — Model performance summaries and key findings
Prediction Demo — Live sentiment prediction for new review text
My Role and the Skills Demonstrated
Role: Data Engineering, Dashboard Development & Cloud Deployment Lead
I was responsible for building the data foundation, the user-facing dashboard, and the cloud deployment of the entire project. My work ensured that the team’s analytical pipeline was not just a set of notebooks, but a usable, deployable application.
Skills Demonstrated:
- Web Scraping — Used Apify to collect and structure real-world data from Google Reviews at scale.
- Data Cleaning & Preprocessing — Built a robust cleaning pipeline that validated schemas, handled missing data, and standardized fields for downstream analysis.
- Exploratory Data Analysis — Created EDA visualizations that identified key data patterns and informed the team’s approach to fairness and model design.
- Natural Language Processing (NLP) — Integrated transformer-based sentiment models (DistilBERT, TinyBERT, DeBERTa) into the dashboard for real-time classification.
- Dashboard Development — Built an interactive Streamlit dashboard with filters, metrics, and live prediction capabilities.
- Cloud Deployment — Deployed the complete application to Streamlit Cloud, making it accessible via a live URL.
- Python Programming — Wrote modular, documented code across multiple stages of the pipeline.
- Collaboration & Communication — Worked in a team of 3, contributed to technical documentation, and presented findings through reports and presentations.
- Version Control (Git) — Maintained organized code with notebooks, data pipelines, and documentation.
- End-to-End Project Delivery — Took a project from raw web data to a cloud-hosted, interactive application — demonstrating full-cycle analytics capability.
Team
This project was completed by:
Naw Mu Aye, Kharla Simangan and myself
Tags
CN Tower, customer reviews, sentiment analysis, NLP, Python, data scraping, Streamlit, cloud deployment, dashboard, Google Reviews, restaurant analytics, tourism, text classification, transformer models, data engineering, Apify, business intelligence, customer feedback, data visualization, Git