
Visibility is power
Built an advanced, multi-page Power BI dashboard for a client company to consolidate fragmented IT procurement data into a single, interactive reporting tool — enabling leadership to track technology spending across years, categories, vendors, and subcategories, with forecasting and drill-down capabilities for confident budgeting decisions.
Problem / Objective
A mid-sized client company was managing its annual IT spending across multiple vendors, service categories, and contract types — from software subscriptions and cybersecurity services to managed IT support, hardware purchases, and cloud hosting. The data existed in scattered spreadsheets and purchase records, making it difficult for finance and IT leadership to:
- See their total IT spending in one place
- Understand which service categories and vendors consumed the largest share of the budget
- Track spending trends over time to support annual budgeting
- Drill down into individual purchases when needed
- Forecast future expenses based on historical patterns
The objective was to build a centralized, interactive dashboard that would give stakeholders a clear, at-a-glance view of their IT spending landscape and enable data-driven budgeting decisions.
Data Source and Scope
- Data source: IT procurement and service subscription records spanning multiple years, including software licenses, managed services, cybersecurity services, hardware purchases, VoIP services, and cloud infrastructure
- Scope: Aggregated spending across multiple categories with multi-level drill-down capability — from category to subcategory to vendor to individual invoice records — plus year-over-year trend analysis and forecasting
Tools Used
- Power BI — Dashboard design, data modeling, DAX measures, interactive slicers, drill-through pages, forecasting visuals
- Excel — Data preparation, cleaning, and validation
- DAX — Cost aggregations, category and vendor measures, year-over-year comparisons, rolling averages
What I Built
An advanced three-page interactive Power BI dashboard with the following structure:
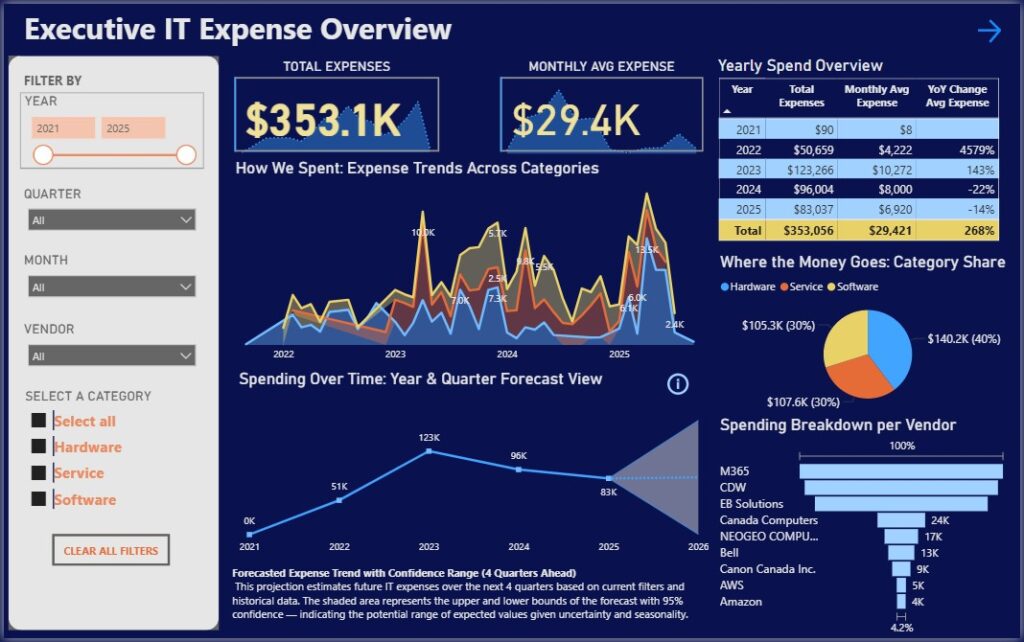
Page 1: Executive IT Expense Overview — A high-level executive summary featuring total expenses, monthly average, year-over-year spending table with percentage change, expense trend area chart across categories, spending over time line chart with forecast projections, category share pie chart, and a vendor spending breakdown bar chart.
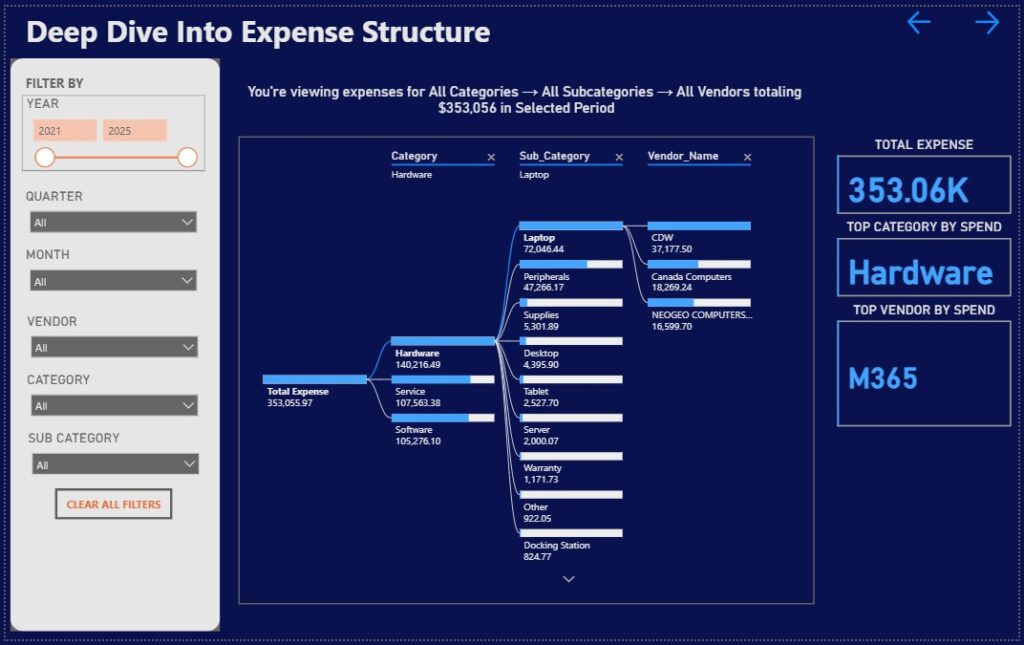
Page 2: Deep Dive Into Expense Structure — An interactive expense tree visualization that enables drill-down from Total Expense → Category → Subcategory → Vendor, allowing users to trace spending at every level. Includes KPI cards for total expense, top category by spend, and top vendor by spend, plus comprehensive filters for year, quarter, month, vendor, category, and subcategory.
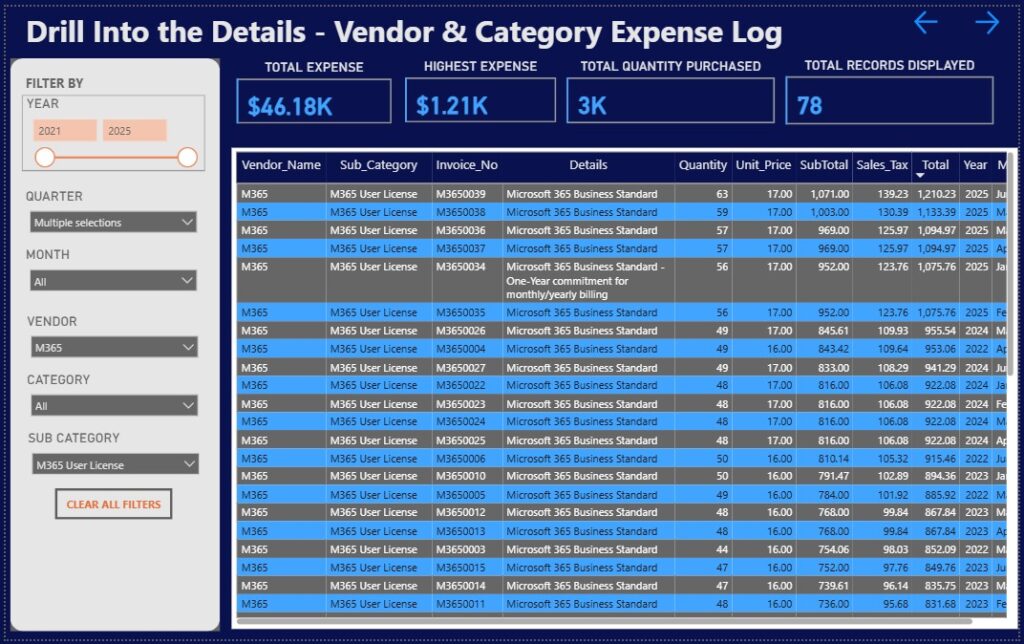
Page 3: Drill Into the Details — Vendor & Category Expense Log — A granular transaction-level table showing vendor name, subcategory, invoice number, details, quantity, unit price, subtotal, sales tax, total, and year. Features KPI cards for filtered total expense, highest single expense, total quantity purchased, and total records displayed, with the same multi-dimensional filters for precise data exploration.
Key Insights / Outcomes
- Enabled leadership to see the full picture of IT spending in one place for the first time
- Identified software and hardware as the dominant cost categories, guiding where to focus cost optimization efforts
- Provided vendor-level visibility, revealing which suppliers represent the largest portion of spending — enabling more informed contract negotiations
- Supported more accurate annual IT budgeting through year-over-year trend analysis with percentage change tracking
- Eliminated the need for manual spreadsheet compilation for finance reporting
- Added forecasting capability to project future IT expenses with confidence ranges
How This Dashboard Supports Decision-Making
Before this dashboard, IT spending data was scattered across spreadsheets and purchase records, making it difficult for leadership to understand the full picture. After, the company has a single, interactive source of truth that enables:
- Immediate visibility — Leadership can see total IT spending and how it breaks down by category, subcategory, and vendor at a glance
- Multi-level drill-down — The expense tree allows users to trace spending from high-level categories down to individual invoices
- Cost driver identification — The dashboard highlights which categories and vendors consume the largest share of the budget
- Historical trend tracking — Year-over-year analysis with percentage change tracking enables more accurate budget forecasting and stronger vendor negotiations
- Forecasting — Future expense projections with confidence ranges help leadership plan ahead with data-backed estimates
- Full auditability — The drill-down detail page lets users trace every dollar back to its source invoice record
Role & Skills Demonstrated
Role: Business Intelligence Analyst / Dashboard Developer
- Received and processed raw IT procurement data from multiple sources
- Analyzed data to identify key spending categories, subcategories, and vendor structures
- Designed and built an advanced multi-page Power BI dashboard with interactive slicers, drill-through navigation, and forecasting visuals
- Wrote DAX measures for cost aggregations, category breakdowns, year-over-year comparisons, and rolling averages
- Implemented a hierarchical expense tree for intuitive multi-level drill-down
- Delivered a polished, stakeholder-ready Power BI report
Skills demonstrated:
- Power BI dashboard design and advanced development
- Data modeling and DAX calculations
- Business intelligence and requirements translation
- Interactive filtering, slicers, and drill-down design
- Forecasting and trend analysis
- Stakeholder communication and report delivery
Tags
Power BI, data analytics, business intelligence, dashboard design, data visualization, DAX, IT spending analysis, financial reporting, data analyst portfolio, BI analyst, reporting analyst, Power BI project, expense tracking, vendor analysis, forecasting, data modeling, portfolio project, data analyst